Welcome to Power BI Desktop
In this section, I describe how a teacher can easily create a well-designed report of his students' results with Power BI Desktop.

Microsoft Power BI Desktop is a free software, which can be downloaded from the site https://powerbi.microsoft.com.

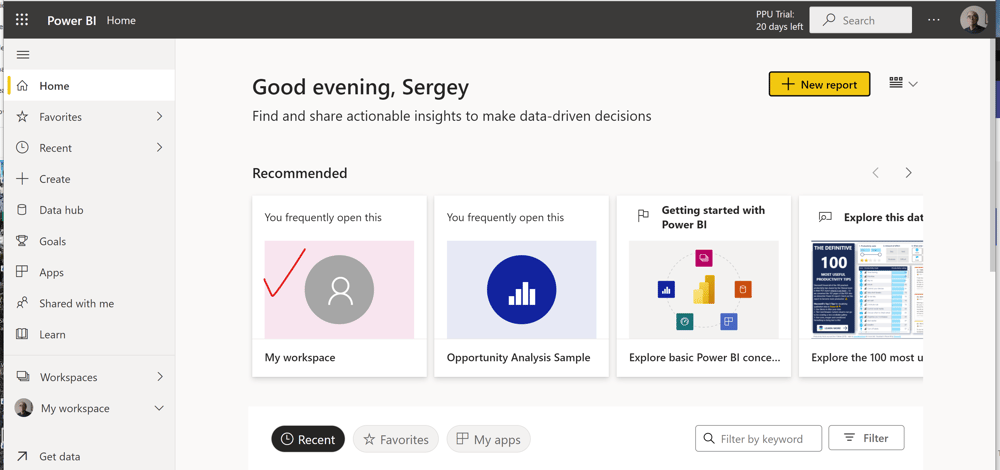
I open this program in my PC and get the interface shown above. Since I already use it, my interface is slightly different from yours. I skip news by pressing the symbol "x" at the right upper corner as shown above.
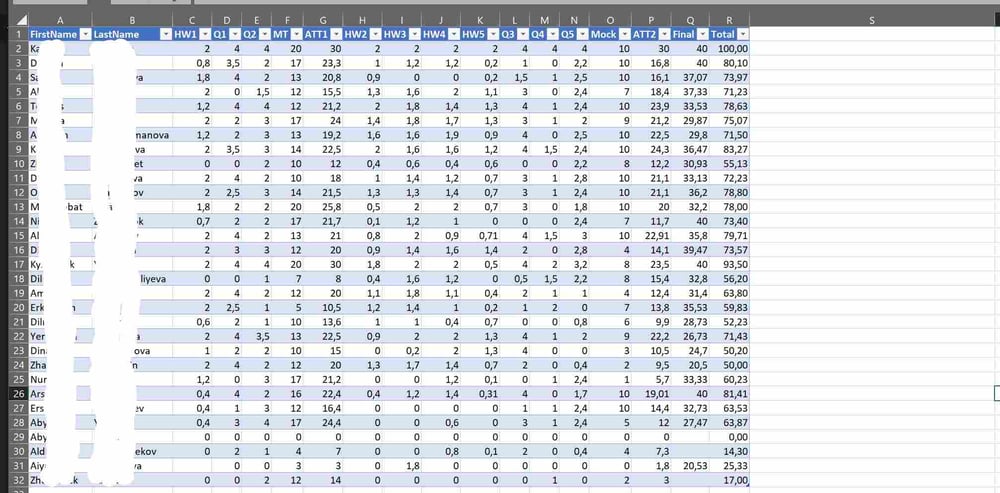
I leave the program for a moment and open the Excel file with students' grades in Excel Desktop. This very file was obtained by the export of my Grade Book made in Microsoft Lists. Since I have A5 license, I could export my Grade Book directly to Power BI Desktop. However, it is not a big deal to make an extra step. Moreover, this may be helpful to apply Power Automate Desktop later. Notice, that this Excel file has a table.
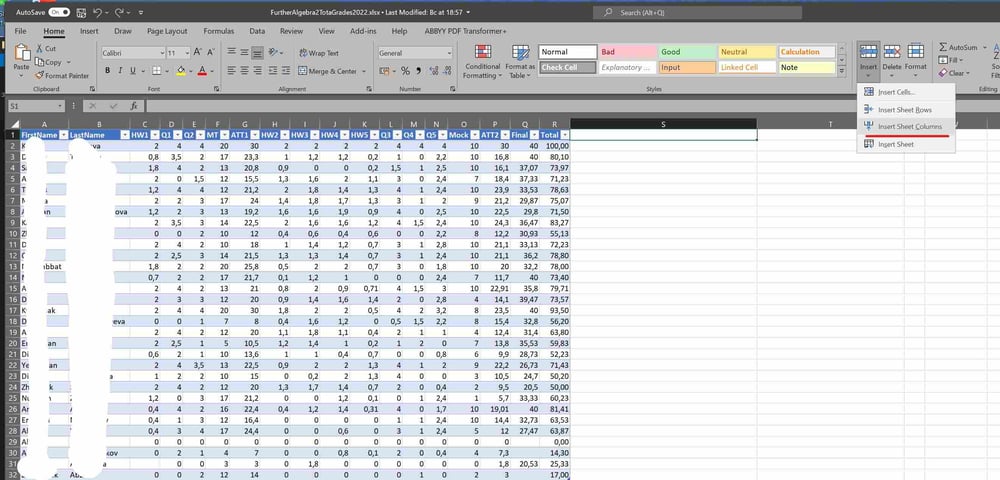
I select the table with the mouse, press the check mark below the "Insert" icon, and select "Insert Table columns to the right."
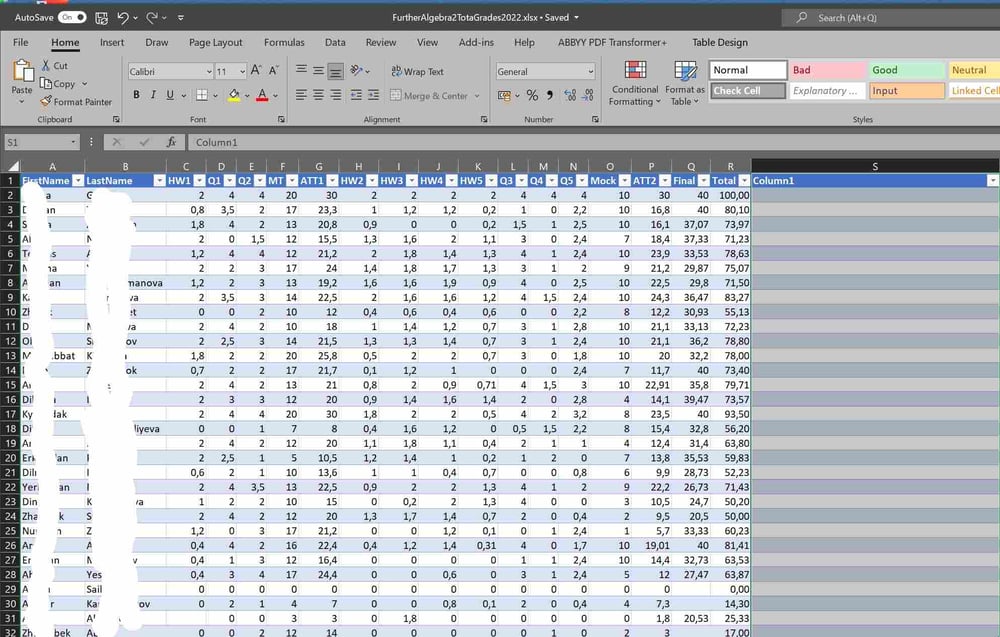
These operations insert a new column "Column 1." I change its name to "Letter Grades" and insert them from the SIS of my University.
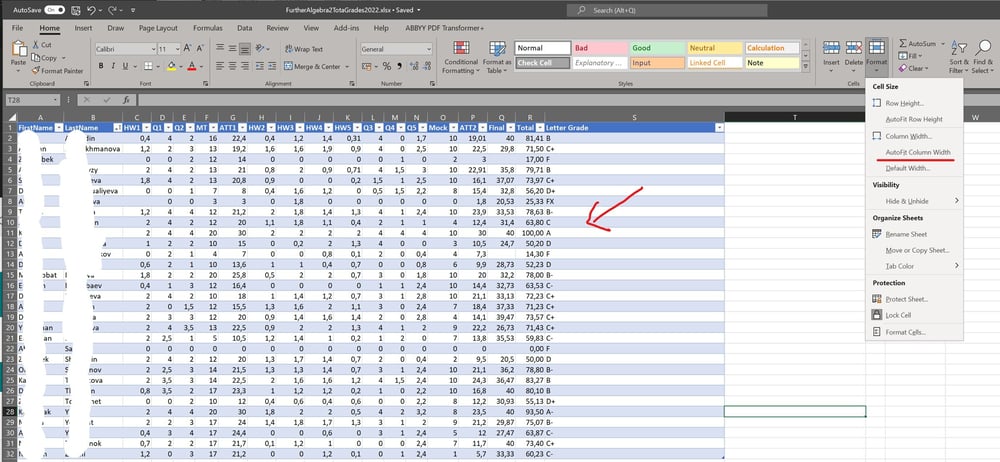
When this column is filled with the letter grades, I click the check mark below the icon "Format" and select the option "Autofit Column Width."
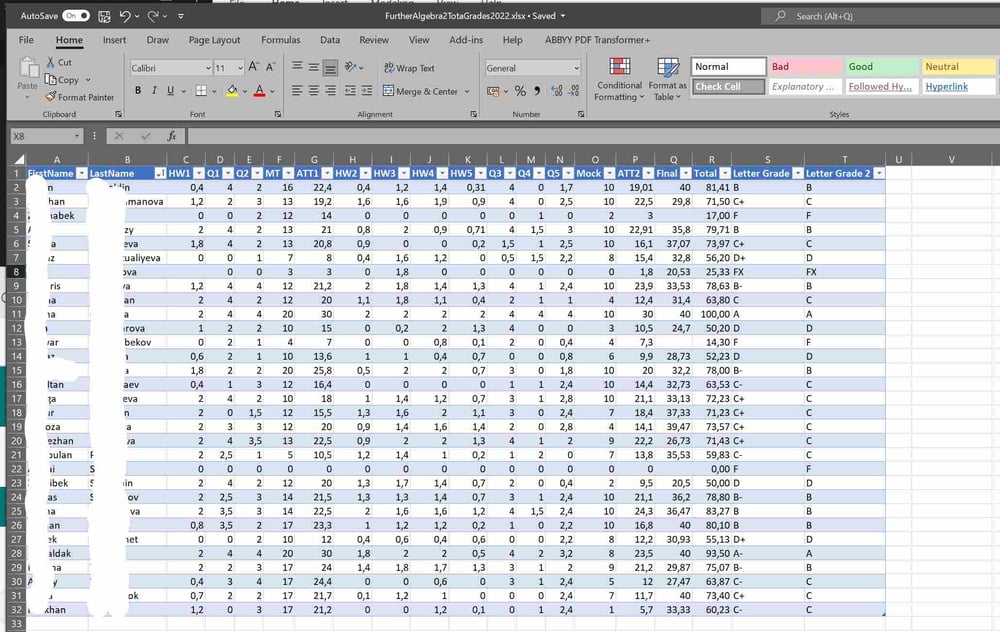
I add another column "Letter Grade 2" and copy the data from the column "Letter Grade 2" to it. Finally, I remove the symbols "+" and "-" to get better visualization in Power BI later. Now my table is ready for the Analysis.
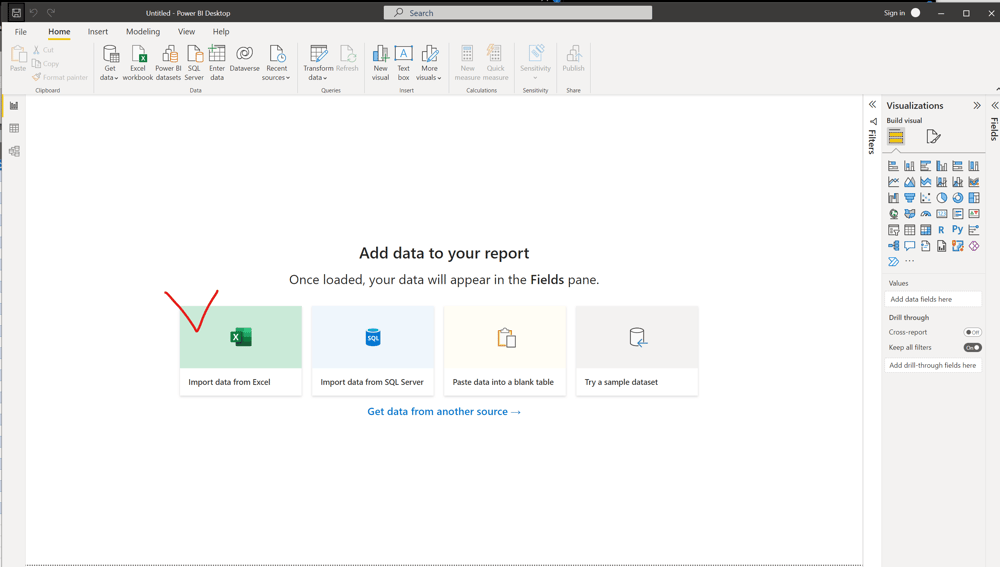
One can add Excel tables using the menu at the top, but it goes faster to press the button "Excel" shown above.
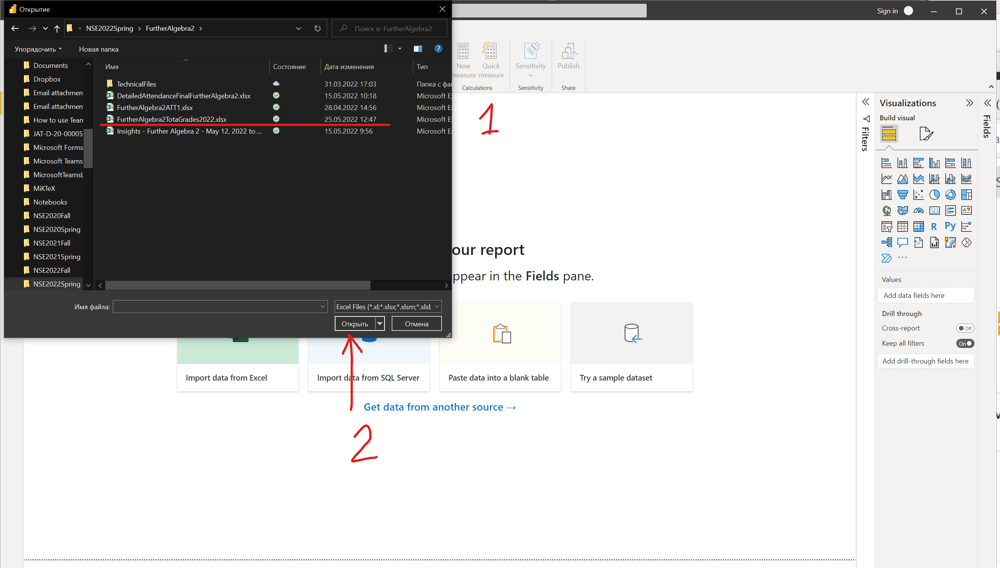
I select the required Excel table (see 1) and upload it to my Power BI Desktop by pressing button "Open" (see 2).
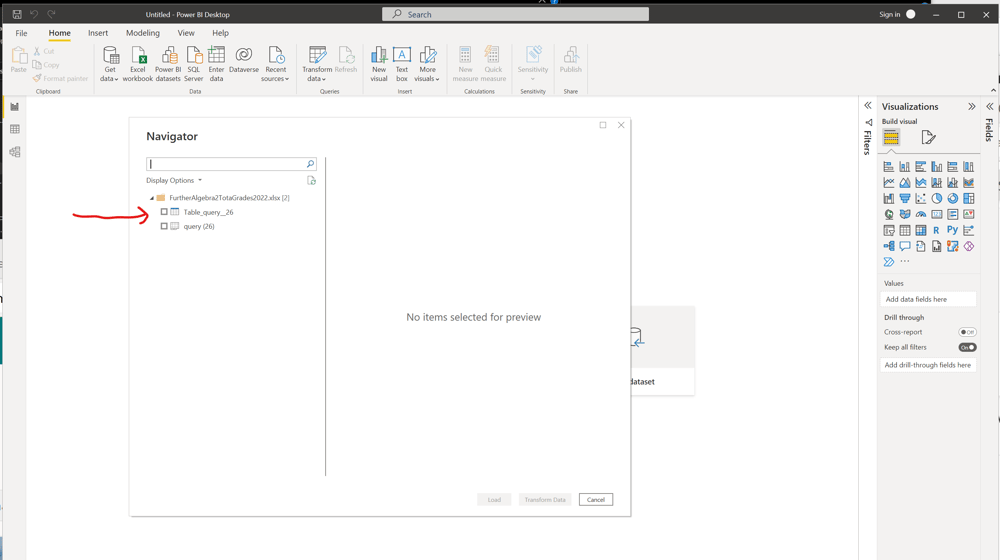
I place the check mark in front of the table name.
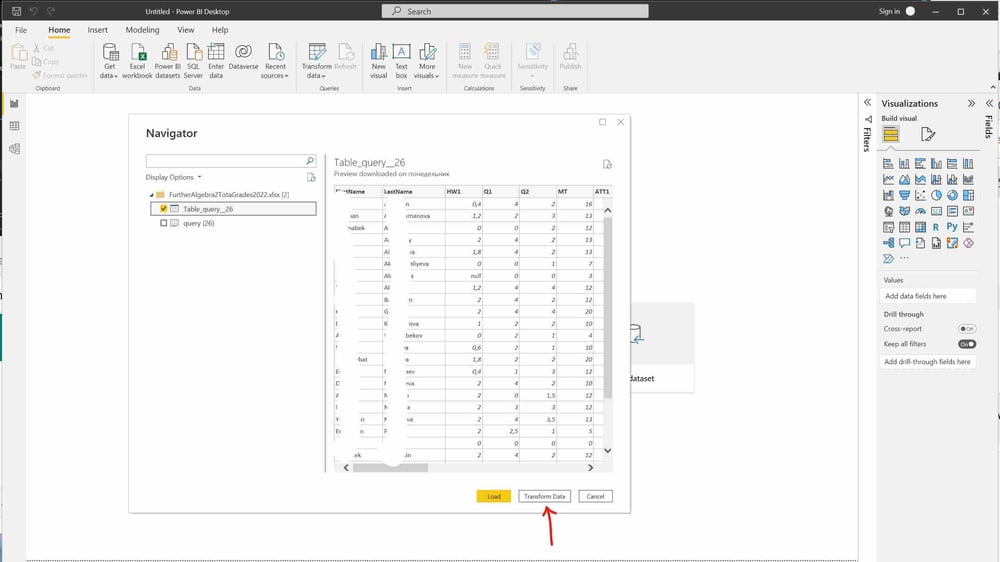
I obtain a preview of my table and select option "Transform Data" since I want to merge the columns with the first names and last names. I could do this in Excel, but this operation demonstrates the possibilities of the Power Query Editor, which I am going to use.
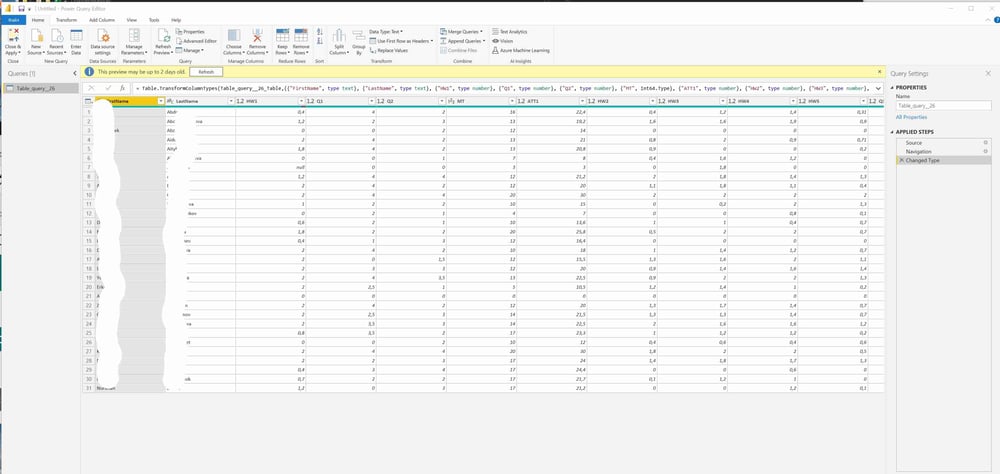
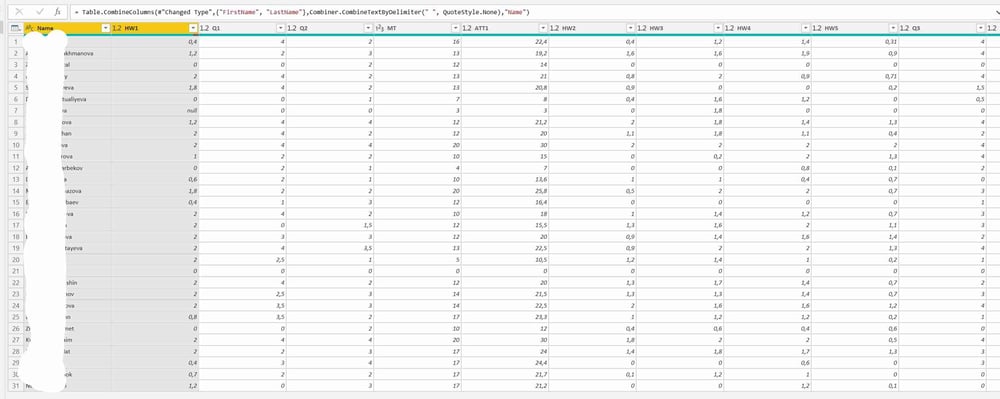
The Query Editor opens the table with the first column selected. It it is not the case you may select it with the mouse. I press "Ctrl" on the keyboard and select the second column by the click on the middle of the title field, see the picture below.
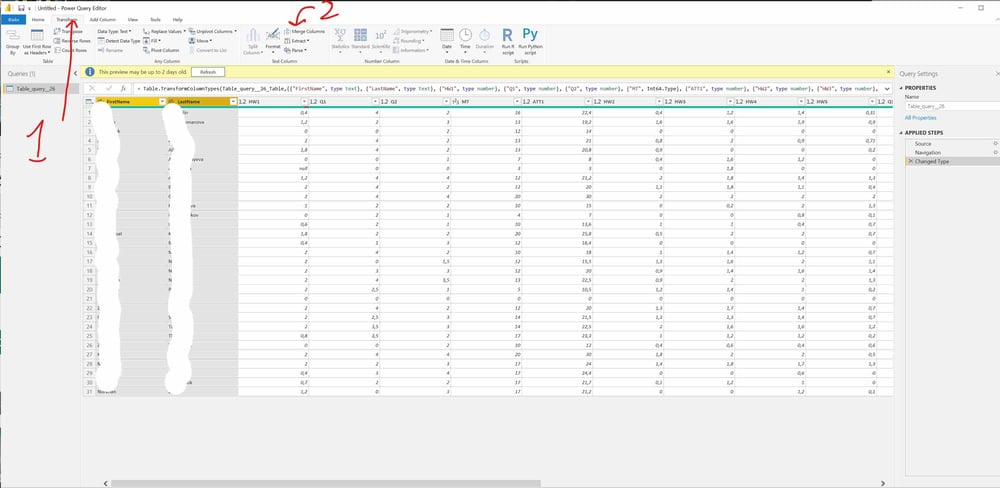
I press the "Transform" tab in the top menu(see 1), and press the "Merge columns" icon (see 2).
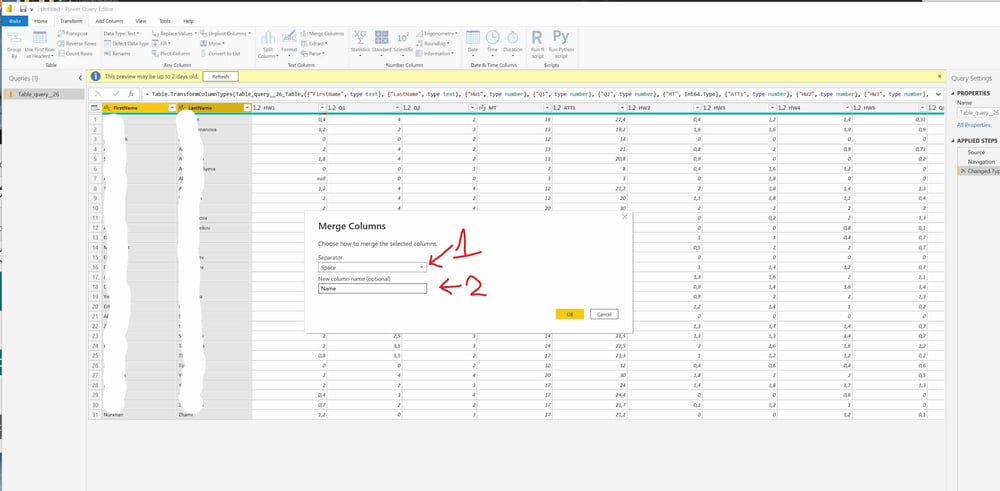
In the "Merge Columns" window, I select "space" (see 1) and type "Name" as the name for the new column (see 2).
I already did this operation several times. Therefore, two columns are automatically merged into one with the given name. It may be possible that in your case, this new column will appear to the right of all displayed columns. In this case, it is better to delete the first two columns. You may right click on the column and press "Delete" for each one.
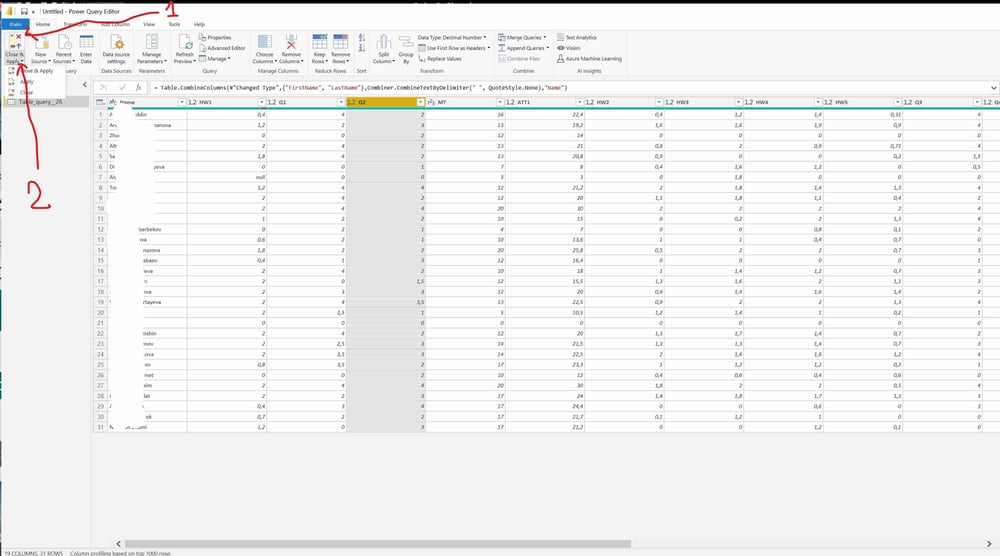
My work in the Power Query Editor is finished. I click the check mark near "Close&Apply," and again click the same name in the drop-down menu.
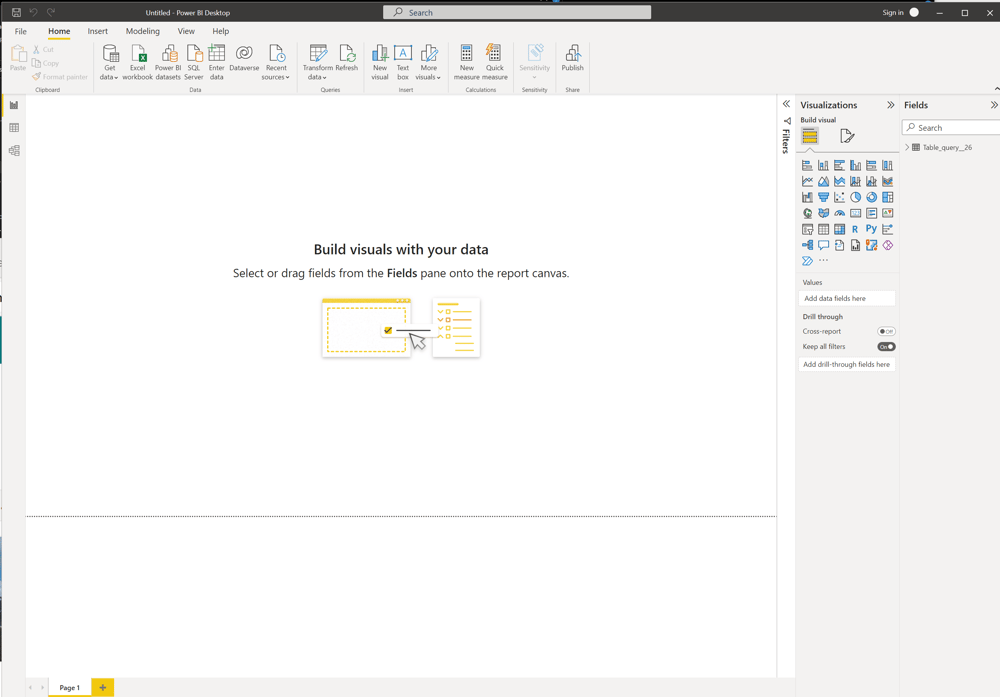
The system saves all corrections made to my table and returns me to the Power BI Desktop.
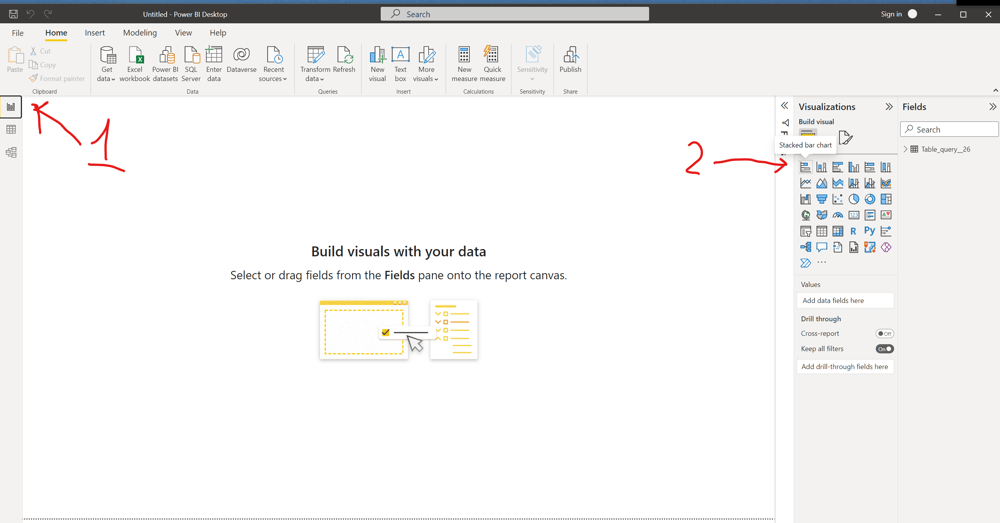
I click the first icon on the left pane (see 1) and then click the graph template shown above (see 2).
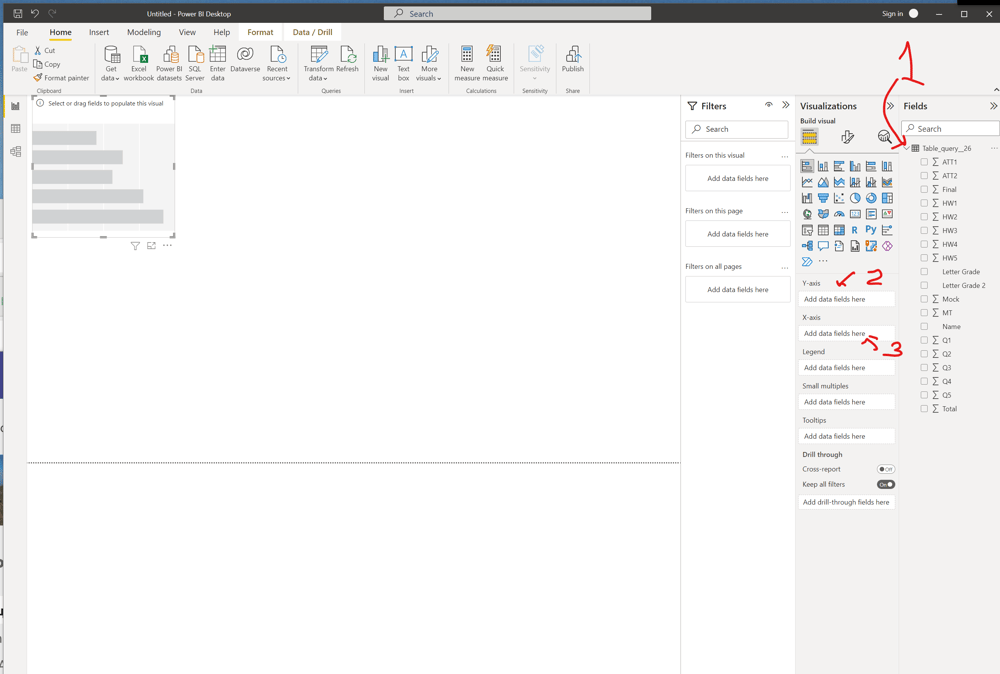
I open the list of the columns' titles in my table by clicking the check mark in front of the name of my table (see 1). I drag the icon "Name" to the field "Y-axis" (see 2), and the icon "Final" to the field "X-axis" (see 3).
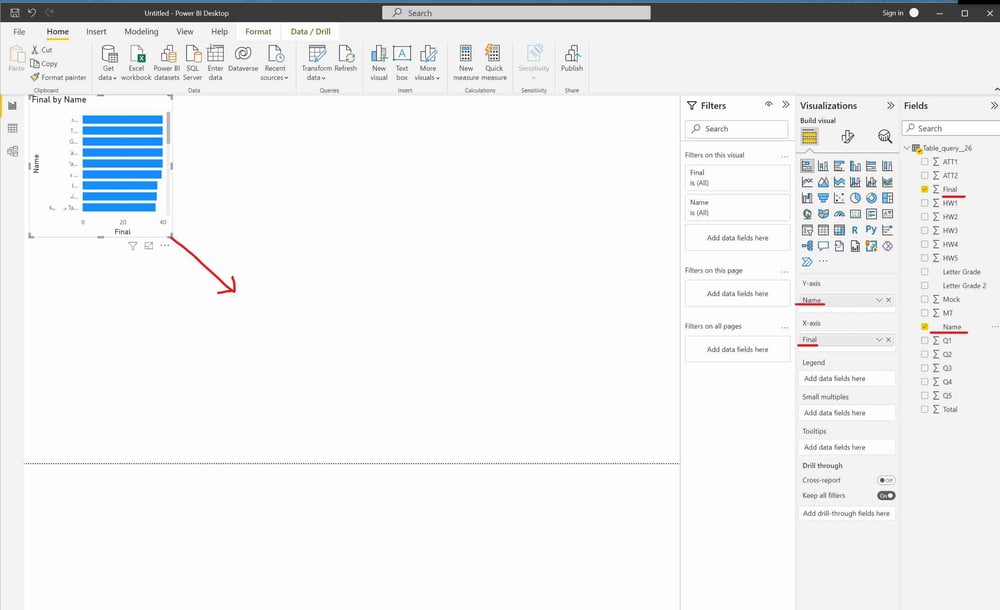
I capture the low right corner of the window with the mouse, and extend the window to fill the left part of the page. One can adjust its size by capturing grey parts of the window boundary.
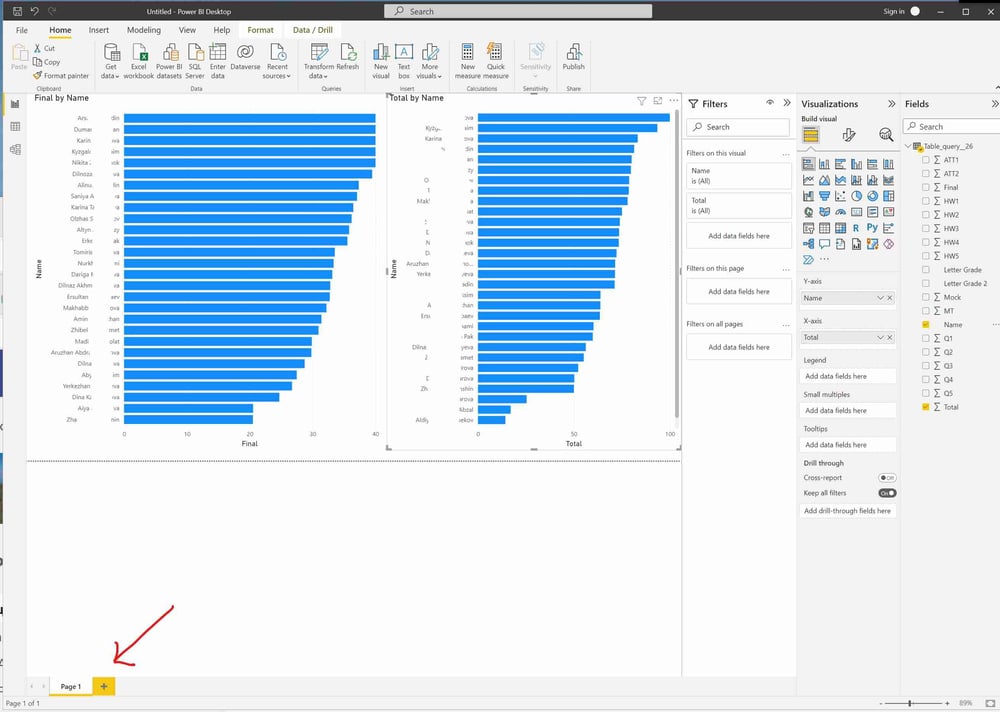
I repeat these operations for the "Total" column. Each of the tables above represents the grades of my students in a convenient way. I add a new page by pressing onto "+."
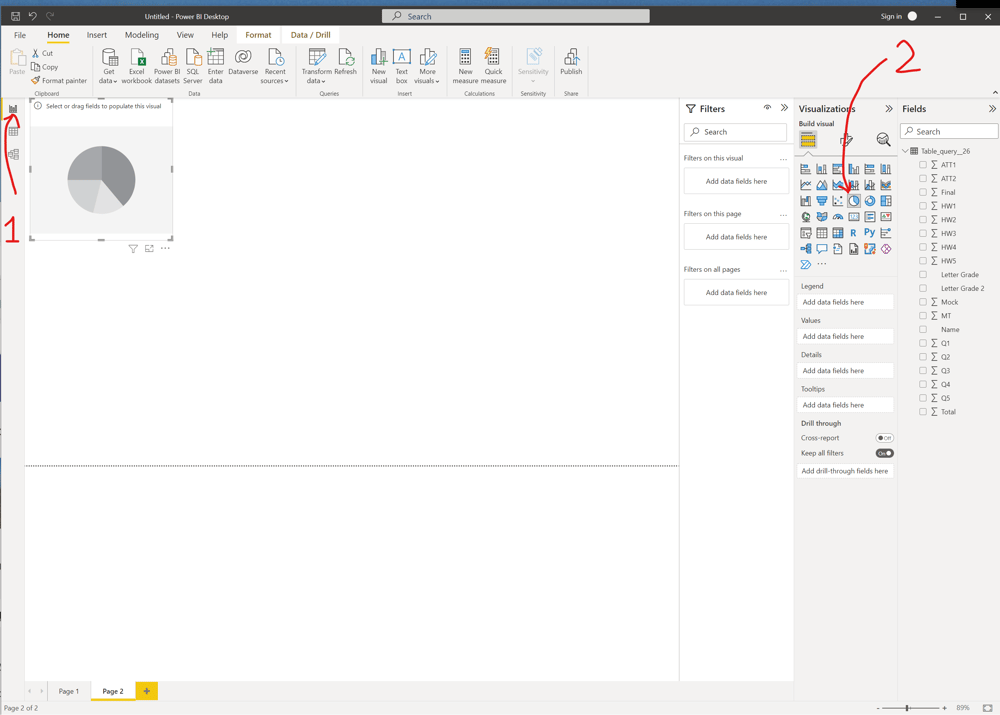
This time I use a pie chart to represent the distribution of my students between the letter grades. I press the first icon on the left pane (see 1), and then the pie chart icon (see 2). Next, I grab the icon "Letter Grade 2" to the field "Legend," and the icon "Total" to the field "Value," see the picture above.
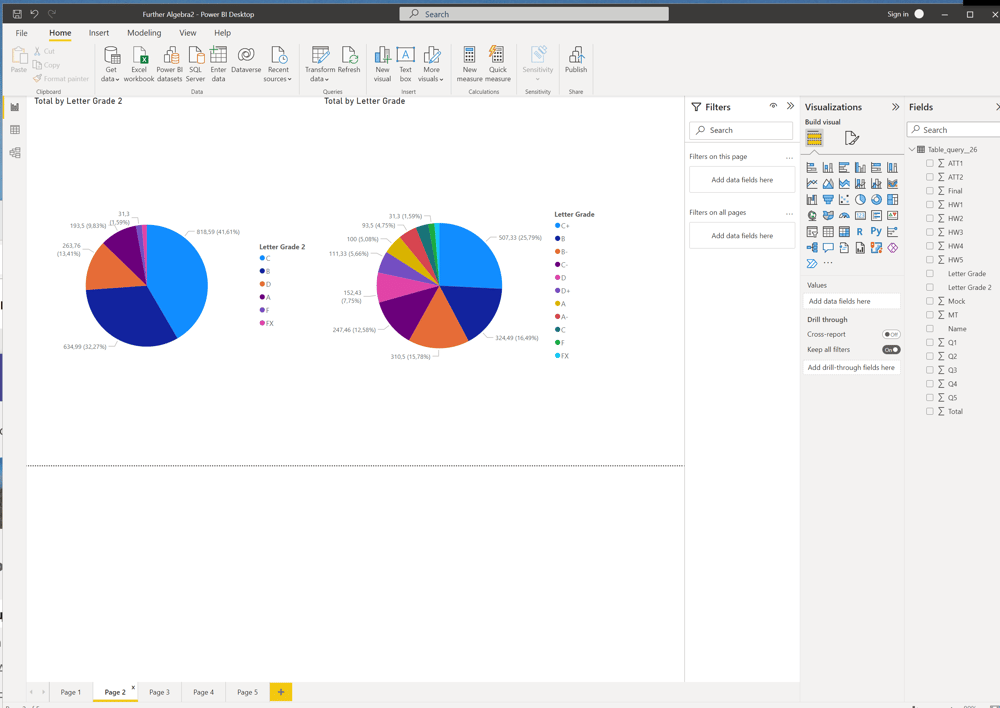
I repeat the same for the column "Letter Grade" to obtain a more detailed picture.
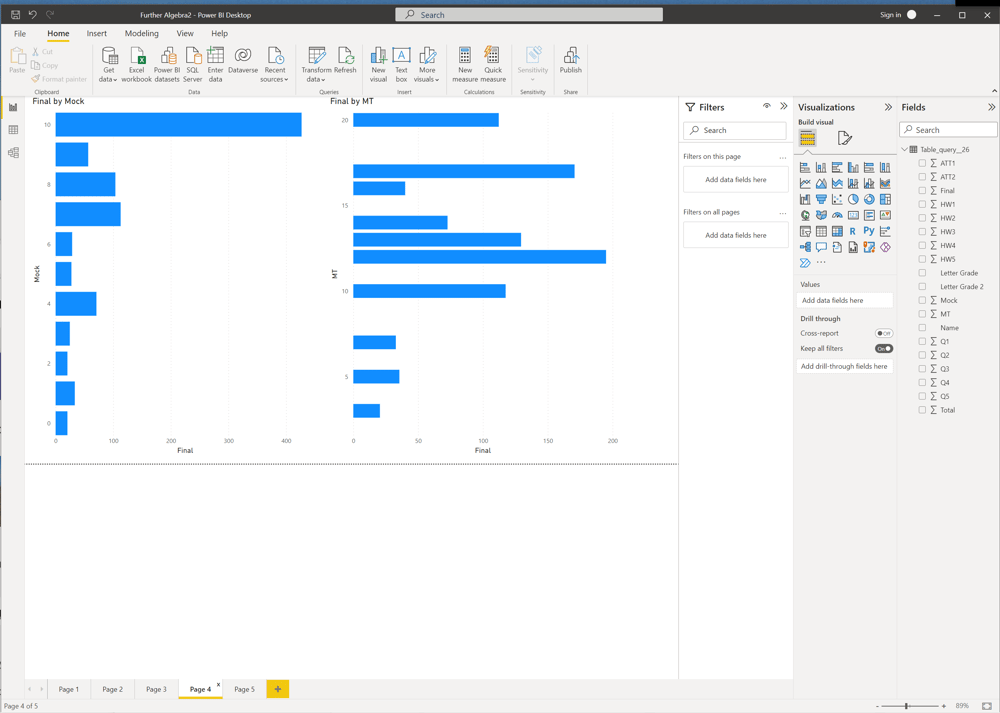
The two graphs above demonstrate the dependence of the final grades from the grades for the Mock exam, and for the Midterm.
This picture shows how to change the default colors of the diagrams. I save my work through the file tab. Using the "File" tab, one can export the report to a pdf file.
Welcome to Power BI Pro
Usually, these are heads of departments who are assigned license A5. One of the possible scenarios is to copy teacher's grade books to the SharePoint of department using the Power Automate described on the page of this site. Then the head or a manager can easily create reports from the grade book copies and connect these reports directly to the SharePoint lists. It is a very convenient method, especially if only separate reports are necessary.
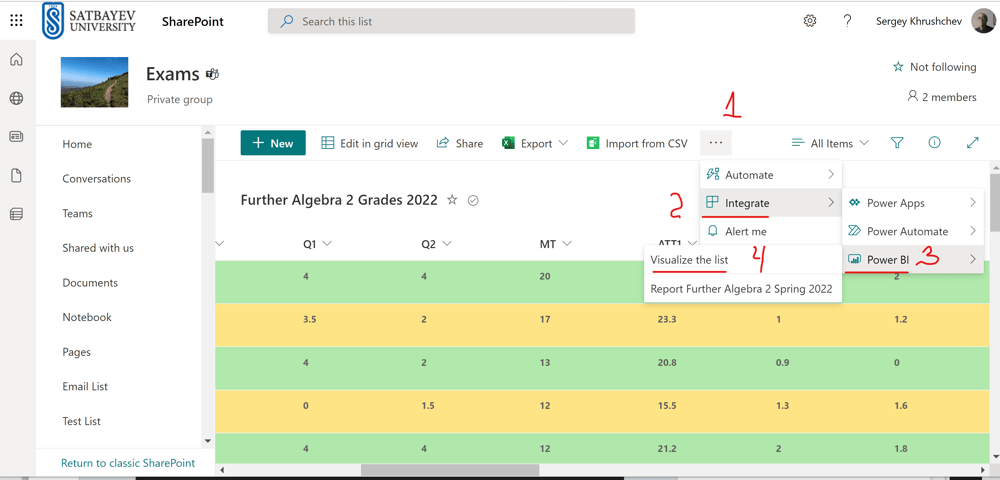
A manager opens the required grade book, clicks onto the ellipsis and follows the directions shown above. Notice that a previous version of the Power BI report based on this very Microsoft list is already available. If the manager clicks "Report Further Algebra 2 Spring 2022," then the report will be opened in a new window. This feature is only available for the owners of the license A5. The manager clicks "Visualize the list" (see 4). This action opens an automatically generated report.
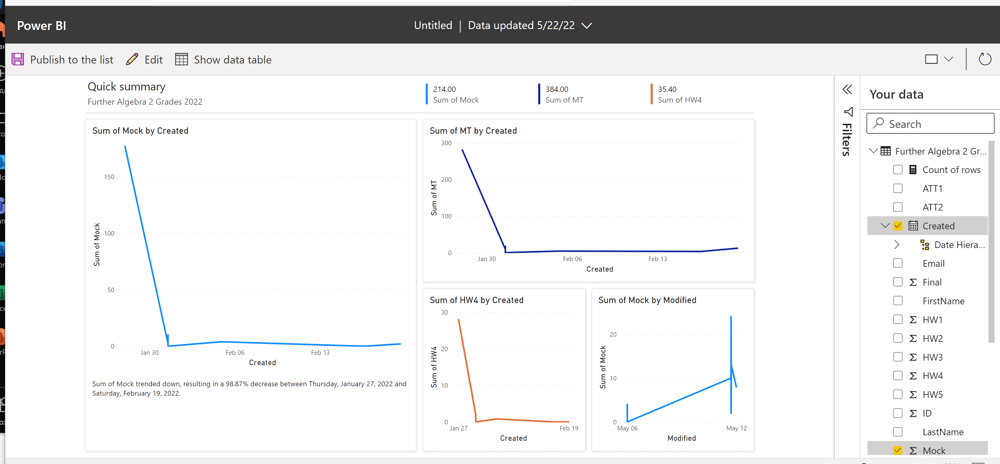
Depending on your previous actions the Power BI displays automatically a number of graphs. By clicking the mouse onto a separate graph and selecting the "Edit" icon on the top menu, you can change the presentation.
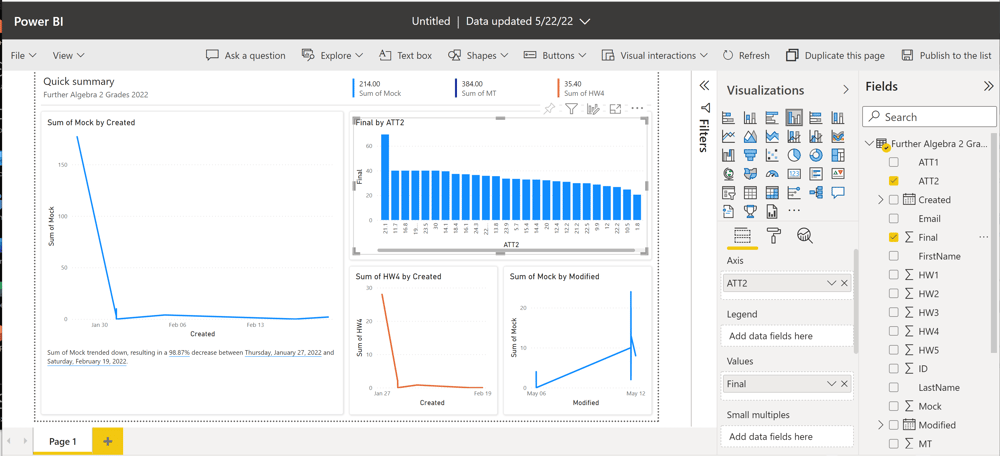
In the example above the icon with vertical bars is chosen. It shows the dependence of the final grades from the grades for the second attestation. The finished report may look as shown on the picture below.
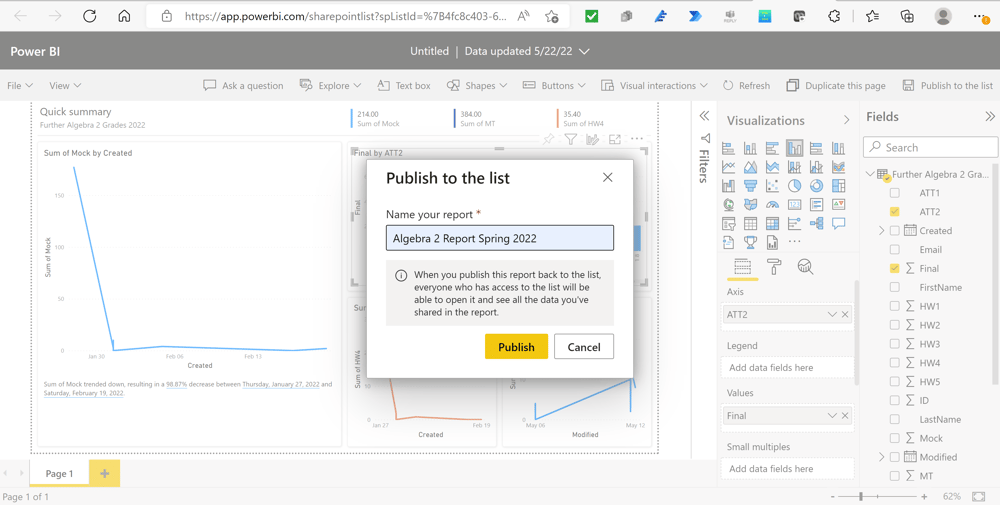
When the report is ready, it can be saved either by clicking the icon "Publish to the list," or "File."
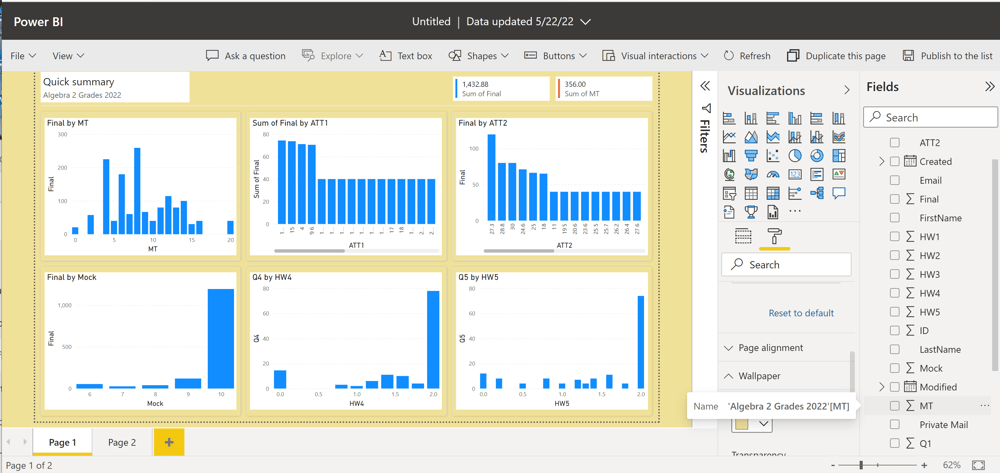
This picture shows how to change the color of the wallpaper.
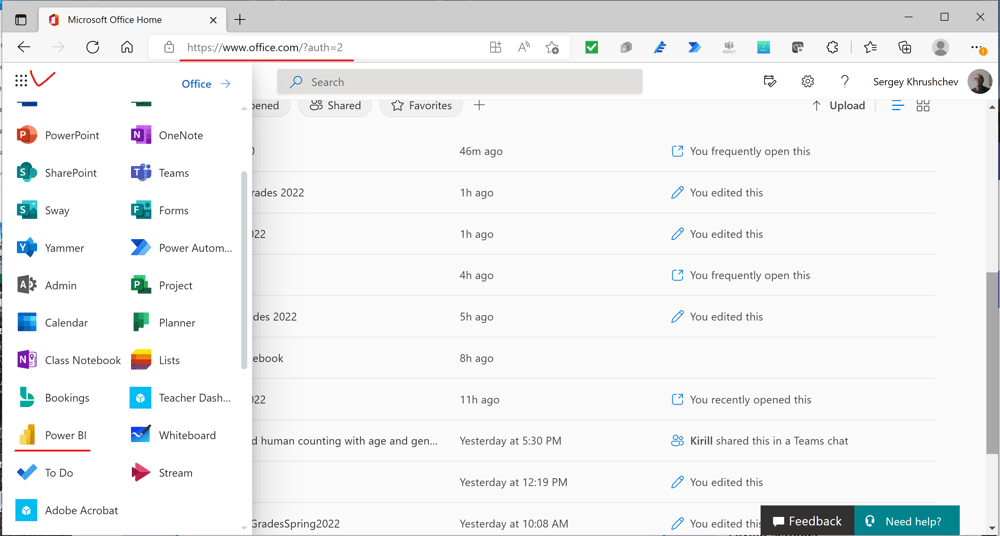
An owner of the license A5, which automatically includes Power BI Pro, gets access to the cloud workspace. One should open the site https://www.office.com and select the icon "Power BI" in the drop-down list.
To open my workspace, I click on the icon indicated above. This action gives me an access to all my reports published to the cloud in Power BI Desktop.
This type of reports should be created in Power BI Desktop and published in my workspace.
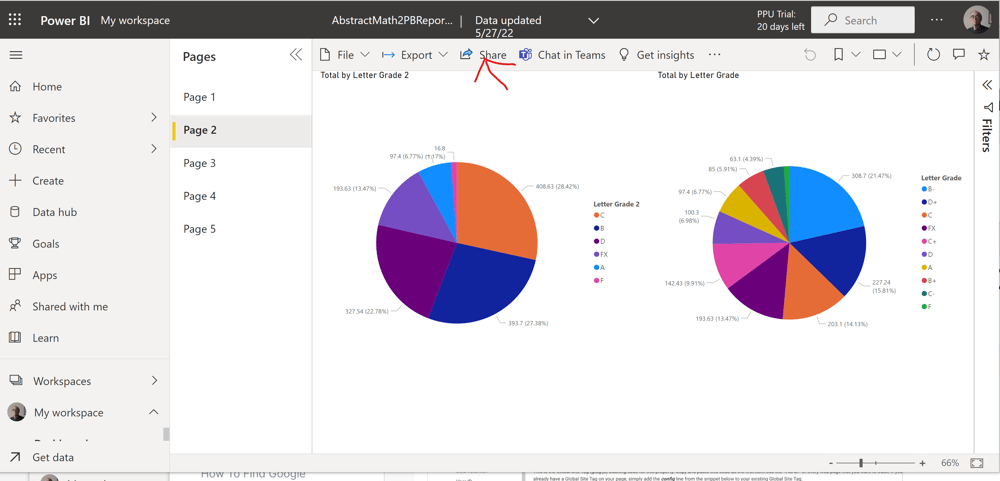
I open my report and chose page 2 in this case. If I press the "Share" button, then this report will be available either to selected people or to a whole team.